

Molecular Modeling of C-Alkylation of Enolates
Sarjit Kaur
Introduction
"Experimental details" /Results
Introduction
Reaction of enolates with alkyl iodides usually give C-alkylated products as shown in eq 1.
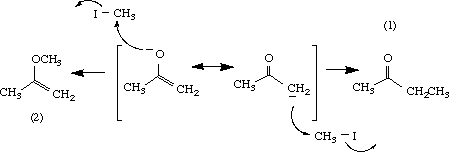
(1)
Several rationales have been used to explain the preferential substitution at the carbon atom of enolates. The carbon is considered more nucleophilic than the oxygen, or the concept of the "hard-soft acid base" may be applied. In the latter, the "softer " carbon is more likely to react than the oxygen atom because the leaving group, iodide ion, is also "soft". Preference for C-alkylation is also observed when the oxygen atom is hydrogen-bonded or exits as an ion-pair, presumably as a result of lowered reactivity at the oxygen atom.
In this exercise, molecular modeling is used to investigate basic enolate chemistry and enolate reactivity by comparing relative stabilities of expected products and activation energies. The study
- reviews the enol <---> ketone equilibrium,
- compares the charge distribution of an enolate minimized by MOPAC to the expected resonance picture of the enolate, and
- models the reaction of acetone enolate with methyl iodide to show that C-alkylation is the preferred product.
"Experimental details" /Results
The following exercises are written for the PC CAChe 3.0 software. These "experiments" are adaptable to other molecular modeling packages. Calculations to determine partial charges using the Mac CAChe software can be carried out using the Project Leader.
I. Enol-Ketone Equilibrium

Build the enol and ketone structures of acetone in the CAChe Workspace and beautify (comprehensive) the structures. Select Experiment (New) and choose the following parameters: chemical sample (Property of), optimize structure (Property) and MM/AM1 (Using). Note the Heat of formation (DHf) given in kcal/mol for the optimized structure. View the final structure using Partial Charge & Calc. Bond Order to obtain partial charges on each atom.
The values of DHf determined for enol and acetone were -39.5 and -49.2 kcal/mol, respectively. The greater stability of the ketone indicates that the equilibrium lies towards the right. Other criteria that can be used from molecular modeling to predict the equilibrium are the partial charges of the alpha proton on the ketone (+0.11) and hydroxyl proton in the enol (+2.11). Using the concept of acid-base reactions where the direction is favored towards the weaker acid, the above equilibrium is favored towards the ketone, the latter being the weaker acid.
The extent to which the above equilibrium lies to the right can be obtained from the equilibrium constant (K), calculated as follows:
- DH = DHf (ketone)- DHf (enol) = -49.2 -(-39.5) = -9.7 kcal/mol
- Assuming that the entropic contribution is small, then DH = DG, where DG = -2.303RT log K
- -9.7 = -2.303 RT log K (where RT is 0.593 kcal/mol)
K = 1.7 x 10⁷ (literature value is ~6 x 10⁸)
The equilibrium constant is large, indicating that the equilibrium is highly favored towards the ketone (on the order of 99.985 % of ketone).
II. Charge Distribution of an Enolate

The enolate intermediate is a composite of two resonance structures, shown above. In general, structure a is likely to contribute more to the enolate intermediate than structure b because the negative charge is on the more electronegative oxygen atom in structure a, the latter being considered more stable. While both resonance structures are considered important, the greater contribution from structure a can be extrapolated to say that the oxygen is expected to carry a larger fraction of the negative charge than the carbon atom. To review this, partial charges are obtained for structures a and b after optimization with MOPAC (AM1).
Build structures a and b of the enolate intermediate in the CAChe Workspace, beautify (comprehensive) and optimize using MM2 in mechanics. After further optimization using MOPAC (AM1), view the structures using Partial Charge & Calc. Bond Order to obtain partial charges for #C and O. Only one set of results will be reported here because partial charges for a and b were similar for corresponding atoms (as expected). The partial charges calculated were -0.641 and -0.591 for #C and O, respectively. The greater electronegativity of the carbon atom was unexpected; currently, it is assumed that valence electron treatment of these structures may be insufficient to quantify the partial charges for direct comparison and higher level calculations may be needed. However, the fairly large negative charges on both oxygen and carbon atoms does support that both structures a and b are important resonance structures, reflecting that both may react as nucleophiles (ambident ions).
IIIa) Prediction of C-alkylation for the Reaction of Acetone Enolate with Methyl Iodide using Saddle Point Determination
Given that both a and b are considered important resonance structures, it is conceivable that both #C and O may react with methyl iodide to give the C-alkylated (1) and the O-alkylated (2) products. In this exercise, relative stabilities of the products and transition states will be determined by molecular modeling to predict the major product.
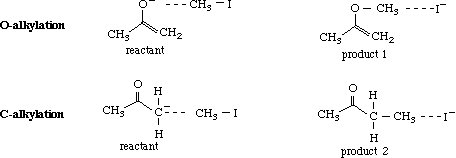
Build products 1 and 2 using CAChe Workspace, beautify the structures and optimize using Mechanics (MM2), followed by MOPAC (AM1) to get the heats of formation of each structure.
To identify the transition states leading to products 1 and 2, build the reactant and product for each reaction using CAChe Editor. Save each structure in a separate file.
Before adding the weak bonds (indicated by dotted lines), beautify the structures. Add the weak bonds (~1.0 Å longer than the normal bond length) and set the bond angles for O, C, I and C, C, I as 180 degrees, simulating the fact that this is an SN2 reaction. Note the heat of formation for each structure after optimization using MOPAC (AM1) calculations. To determine the transition state, select New from Experiment and use the following parameters: Reaction and Transition states (Property of:); Search for Saddle Point (Property: ); AM1 (Using:). Start the experiment after selection of the appropriate reactant and product for the O-alkylation reaction. The structure of the transition state is saved in the reactant file. Repeat the experiment for C-alkylation reaction. [NOTE: For a valid run, the change in heat should be fairly gradual. If the energies change randomly, going high and low, the calculation is invalid and should be halted. Inappropriate transition states should be ignored where hydrogen or iodine show more than the expected number of bonds and unacceptable bond angles. It takes several attempts to find the saddle point. This experiment may not be appropriate for students but is reported here because, when it works, the results compare with the second method for determining transitions states (outlined in the next exercise).]
The heat of formation (DHf) of the reactants, products and transition states (TS) are reported below, along with relevant bond lengths used in identifying the saddle point.
| DHf, kcal/ mol | Bond lengths, Å | ||||||||
| Reactant | Product | TS | Reactant | TS | Product | ||||
| O--CH3 | H3C-I | O--CH3 | H3C--I | O-CH3 | H3C--I | ||||
| O-Alkylation | -45.2 | -39.5 | -24.9 | 2.60 | 2.07 | 1.86 | 2.33 | 1.44 | 3.40 |
| C--CH3 | H3C-I | C--CH3 | H3C--I | C-CH3 | H3C--I | ||||
| C-Alkylation | -44.6 | -57.6 | -29.0 | 2.50 | 2.07 | 1.60 | 2.00 | 1.50 | 3.00 |
The activation energies, calculated from the change in enthalphy in going from the reactant to the transition state, are +20.3 and 15.6 kcal/mol for O-alkylation and C-alkylation, respectively. The overall enthaphy change of the reactions, obtained from the differences in the heat of formation between the reactant and product, are +5.7 and -14.0 kcal/mol for O-alkylation and C-alkylation, respectively. These results predict that C-alkylation is the preferred product because i) the activation barrier is smaller (lower in energy) than O-alkylation and ii) the reaction is exothermic while O-alkylation is an endothermic process.
IIIb) Prediction of C-alkylation for the Reaction of Acetone Enolate with Methyl Iodide using Potential Energy Surface Maps
A second approach can be used to confirm the DHf calculated in the above exercise for the transition states. Potential energy surface maps were generated using an optimized conformational analysis.
Using the CAChe Workspace, build the reactant structure for C-alkylation (without the weak bond), beautify the structure and set the bond angle for H2C-CH3-I as 180 deg. Optimize the structure using AM1. Select atoms (in bold) H2C- and C-I and choose atomic distance from View to set the distance to 3.00 Å. Click Define Geometry, select Search and set the range from 3.00 to 1.54 Å for ~25 steps. Complete the entry by hitting Apply, followed by Done. Next select atoms H3C-I and follow the same preceding steps to set the range from 2.07 to 3.00 Å in ~25 steps under the Search field. Save the file to include the changes.
Select Experiment (New) and choose the following selections for the indicated fields: chemical sample conformations (Property of), optimized map (Property) and AM1 energies/2 labels (Using). Start the experiment. If any error related to positions or distances of atoms occur, note the file name given at the bottom of the paragraph describing the experiment (something like p2028). Using a word processor program, open this file, and scroll to the line that says ExtraKeywords. Place the cursor at the end of the line, hit return and enter "geo-ok". Save the file and run the experiment again.
To look at the results of the conformational analysis, open the file using .MAP file type. Select the appropriate file and click on the energy icon which will open two windows on the screen. The left window is the potential energy profile and the right window shows the lowest energy structure. Different positions on the energy map profile can be selected, and the corresponding structure is displayed in the right window. Find the lowest energy path between the starting (resembling the reactant) and final (resembling the product) structures. The highest energy point (or least negative kcal/mol value) along the lowest energy path is identified as a reasonable transition state (note the relevant bond lengths and DHf). The potential energy maps and transition states are shown in Figures 1 and 2 for O-alkylation and C-alkylation, respectively. The molecular structure corresponding to the transition state is copied and pasted into a new window; save as a new file for further refinement of the transition state structure.
The transition state can be refined further by running another experiment with the following selections: Reaction/Transition, Refine and AM1 energies/2 labels. Note the DHf reported for the refined transition state. A single negative peak by vibrational spectroscopy indicates that a transition state has been located; this experiment is run by choosing Reaction/Transition, Verify Transition state and MOPAC AM1 force. View the results of the vibrational spectroscopy under IR transitions.
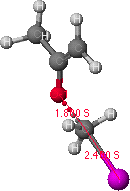
Figure 1. Potential energy surface map for O-alkylation is shown on the left.
The structure on the right is a probable transition state, as determined from
the highest point (indicated by the grey dot) found along the lowest energy path from the reactant to the product structures.
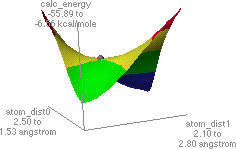
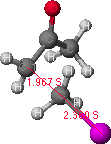
Figure 2. Potential energy surface map for C-alkylation is shown on the left.
The structure on the right is a probable transition state, as determined from
the highest point (indicated by the grey dot) found along the lowest energy path from the reactant to the product structures.
The above optimized conformational analysis is repeated for the O-alkylation reactant. Set the atomic distances for O-CH3 and H3C-I at 2.40 and 2.1 Å, respectively. Searches for O-CH3 and H3C-I are from 2.40 to 1.5 Å (~15 steps) and from 2.07-3.10 Å (~20 steps), respectively.
The heat of formation (DHf) and bond lengths for the reactant, product and transition state are listed below.
| DHf, kcal/ mol | Bond lengths, Å | ||||||||
| Reactant | Product | TS | Reactant | TS | Product | ||||
| O--CH3 | H3C-I | O--CH3 | H3C--I | O-CH3 | H3C--I | ||||
| O-Alkylation | -44.2 | -37.9 | -24.8 | 2.40 | 2.07 | 1.80 | 2.50 | 1.50 | 3.10 |
| C--CH3 | H3C-I | C--CH3 | H3C--I | C-CH3 | H3C--I | ||||
| C-Alkylation | -43.3 | -54.5 | -31.2 | 2.50 | 2.07 | 1.97 | 2.38 | 1.53 | 3.75 |
The activation energies, calculated from the change in enthalphy in going from the reactant to the transition state, are +19.6 and 12.2 kcal/mol for O-alkylation and C-alkylation, respectively. The overall enthaphy change of the reactions, obtained from the differences in the heat of formation between the reactant and product, are +6.5 and -11.9 kcal/mol for O-alkylation and C-alkylation, respectively. These results predict that C-alkylation is the preferred product for the same reasons concluded for III(a).