
Product Distribution in the Nitration of Toluene
SELECTED RESULTS
Table 1. Selected energetic data in the nitration of toluene from ChemCAChe
chemical sample |
energy steric (kcal/mol) |
energy total (Hartree)* |
heat of formation (kcal/mol) |
heat of reaction (overall) (kcal/mol) |
heat of reaction (to arenium ions) (kcal/mol) |
|
| toluene | -8.597 | -44.783 | 14.114 | |||
| o-nitrotoluene | -7.108 | -76.581 | 8.067 | -31.7471 | ||
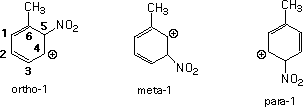
| ortho-1 | 2.581 | -77.082 | 216.146 | 234.1319 | ||
| m-nitrotoluene | -9.043 | -76.592 | 5.092 | |||
| meta-1 | 2.295 | -77.077 | 218.415 | 236.4009 | ||
| p-nitrotoluene | -9.061 | -76.595 | 4.71 | |||
| para-1 | 2.545 | -77.096 | 213.369 | 231.3549 | ||
*One Hartree is approximately 627 kcal/mol.

The energy values follow the expected trend favoring ortho and para substitution over meta.
Susceptibility in the Nitration of Toluene

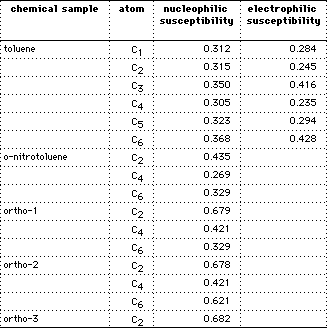
The electrophilic frontier density is a measure of the susceptibility of the substrate to attack by an electrophile. Electrophilic frontier density reveals reactive sites based on the electron distribution of active orbitals near the HOMO. It is determined at atoms after optimizing the molecular geometry using augmented MM2 followed by MOPAC with PM3 parameters10,11.
The nucleophilic frontier density is a measure of the susceptibility of the substrate to attack by an electrophile. This parameter reveals reactive sites based on the electron distribution of active orbitals near the LUMO10,11. Calculations are performed in a similar manner as for electrophilic susceptibility. Nucleophilic susceptibility may be applied to the arenium ions generated from ortho, meta or para attack of toluene by the nitronium ion. Values for carbons bearing a positive charge, through resonance, indicate the degree of positive charge with the larger number reflecting a greater charge. For example, the average values for the three carbons bearing positive charge for ortho-1 are 0.48 whereas for para-1 averages 0.57.
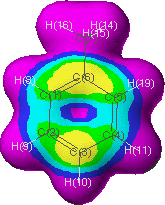
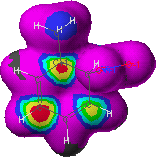
Finally, electron density diagrams may be obtained using Tabulator for toluene and the three modes of substitution. Representative cases are shown in Figures 3 & 4.
Figure 3 Electron frontier density map for toluene

Probability for electrophilic attack decreases in order of the regions colored: grey, red (0.005 at grey-red interface), yellow, green, aqua, blue, purple and black (0 at black-purple interface). Note: the color scheme may be set to user preferences10.
Figure 4. Electron frontier density for nucleophilic
attack on the o-nitrotoluene arenium ion (ortho-3)


Red and yellow regions indicate greatest probability. Probability for nucleophilic attack decreases in order of the regions colored: grey, red (0.005 at grey-red interface), yellow, green, aqua, blue, purple and black (0 at black-purple interface).